
Sensa makes industrial AI possible
Reduce waste. Improve operations. With AI that understands how it all connects.
Calculated annual value from better operations: 3–5% of revenue.
Calculated from the customer’s own data and confirmed by the customer.
3–5%lower feed consumption
RAS smolt facilityHidden feed waste in an automated feeding system
Detailed feed data showed unnecessary feeding just before midnight. The operations team fixed the fault in the control system and stopped the unnecessary feeding.An estimate based on the facility’s own data. The savings have not been independently verified.
- 01
The operational problem
Feed is one of the largest production inputs, but daily totals can hide brief faults and feeding at the wrong time. Automated feeding equipment can behave incorrectly while the daily reports still look normal.
- 02
What the data showed
Detailed feeding data showed unnecessary feeding just before midnight, again and again. The cause was an old rule in the control system designed to ensure the daily feeding target was met.
- 03
The action taken
The operations team looked into the feeding, fixed the fault in the control system and stopped the unnecessary feeding.
NOK 33 millionlower capex, same guarantee
Biofilter in a new buildA smaller biofilter with the same supplier guarantees
Data from a reference facility showed that a smaller biofilter would meet the requirements. The supplier approved the change without altering the guarantees.Estimated reduction in capital cost, based on the project’s own calculations.
- 01
The operational problem
A major land-based project planned 96 tanks with biofilter volumes specified by an equipment supplier. It was uncertain whether the biofilters could be sized smaller without affecting the supplier guarantee.
- 02
What the data showed
Quality-assured real-time data from a reference facility showed that a biofilter considerably smaller than first assumed would meet the requirements.
- 03
The action taken
The supplier approved the smaller biofilter without altering the guarantees.
Having combined sensor data and parameters such as temperature and oxygen in real time with data on fish health and biology on the Sensa platform gives us a far better picture of the fish’s living conditions.
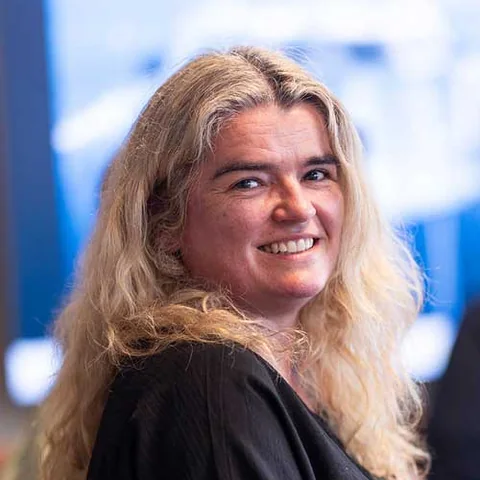 Birthe BogeHead of Innovation and Development at FishGlobe Technologies
The data is there. Put it to work.
Aquaculture
- OperationsGet better control of productionUnderstand the connections between feeding, water quality and fish health. Spot deviations earlier, reduce waste and find measures that improve growth and fish welfare.
- MaintenanceSpot signs of faults earlierAnalyse sensor data alongside maintenance history. Spot when filters, pumps and other equipment start to underperform, and plan maintenance before it affects production.
- InvestmentSize investments to match operational needsUse operating data to assess capacity and size new facilities and equipment. Get a better basis for investment decisions and avoid unnecessarily high costs.
Shipping
- OperationsLearn from the ships that perform bestCompare fuel use across ships and crews under comparable conditions. Find the operating patterns that lower consumption, and apply the lessons across the whole fleet.
- MaintenanceSpot signs of wear earlierAnalyse sensor data alongside maintenance history. Distinguish changes in load from signs of a fault, and plan maintenance before operations are affected.
- ReportingRecord once. Reuse across systems.Collect and quality-check operating data once. Reuse it in reports and systems, with less manual work and fewer errors.
Renewable energy
- OperationsGet more out of power plants and gridsSee operating data in the context of how equipment and systems work. Identify bottlenecks and opportunities to reduce losses and make better use of capacity.
- MaintenancePlan maintenance based on conditionUse sensor data and maintenance history to assess the condition of the equipment. Distinguish normal variation from signs of a fault, and prioritise maintenance before generation or power supply is affected.
- PreparednessBe ready for disruptionsSee which sites and functions are affected by faults or extreme weather. Connect this information with emergency plans, spare parts and available resources, so operations can be restored faster.
- Sensa UnityBrings your data together, checks its quality and adds operational context, so you can put it to work.
- Unity AIAsk about operations in plain language and get answers grounded in data and an understanding of your facility.
- Sensa OptimizerPlan the entire production cycle and replan in minutes when something unexpected happens.
- AqualogRecord data digitally once and reuse it in reports, analyses and other systems.
- Sensa LabsBuild the apps you need on quality-checked data, independently or with our help.Example: Pellet Monitor
Start small.
Prove value.
Scale.
- Weeks 1–2Connect the data
- Weeks 3–6Put the data to work
- Weeks 7–12Measure the impact
- ThenScale
Limited investment in the first 90 days.